Official infos on this submission
Resources being used: The Wikidata (MediaWiki) API, the Wikimedia Commons File API and DeepaMehta 4 as the GNU GPL 3 licensed plugin development environment.
Video graphic: http://youtu.be/7pn1dHWNb3E
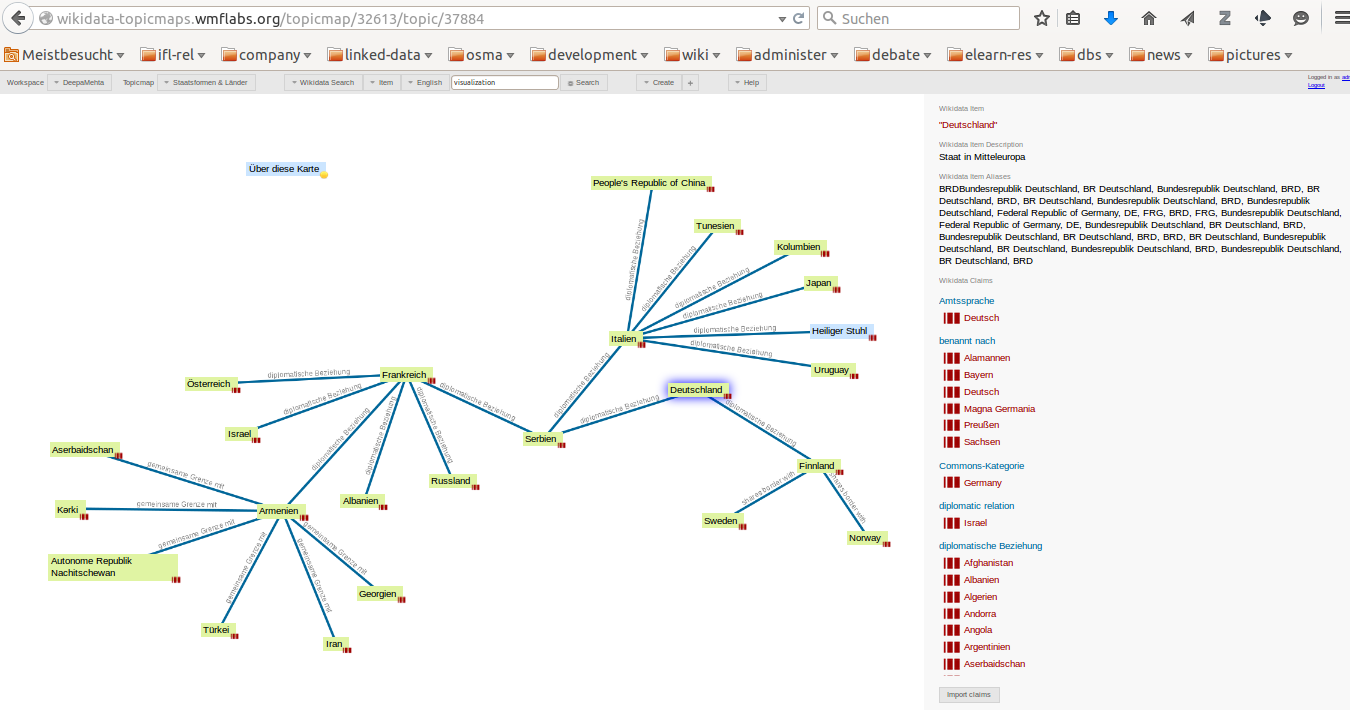
Info graphic: See below, a map-image showing states currently “having¹ a diplomatic relationship” and “sharing¹ a border” according to wikidata, illustrating the concept of Statements as edges connecting items.
Accomplishments during competition time: No programming, just using the tool described here to create some exemplary visualizations and an attempt to improve on the documentation through the following article.
Info visualization (interactive): http://wikidata-topicmaps.wmflabs.org/topicmap/32613/topic/133713
Article on this submission
I do not know if this will count as a submission as the last time i coded something for this was April but hey, let’s give it a try. I researched and developed the Wikidata Topicmaps UI, a user interface and a voluntarily “managed” service with which you can ask wikidata simple text queries in your language of choice and interactively construct personal, handmade views on the dataset. I hope you like it and please do not hesitate to give feedback to me. If you can help me to improve it or continue to work on it, that would be awesome too. Especially since this interactive visualizations architecture is open source and pluggable, together, if this kicks you, we could easily work on extending the expressiveness of any visualization users can now make with this service.
Currently two of the special feature of this user interface related to creating expressive visualizations is free placement in stable geometries (stored independent of the contents) and colouring of items. This may seem a bit limited, i see, but please take a moment to get to know more about the power of this approach. Therewith created views or geometries always represent personal selections of items taken from wikidata and are officially a mix of a mind map and a concept map. As there must be no central topic, as in a mind-map, complex arrangements on the infinite canvas are explicitly supported. To facilitate this, start dragging a relation does let users move and re-arrange the position of a whole cluster of items.
With this basic “search, import and arrange” functionality you can find out a whole lot about the structure of wikidata, like Properties and Statements and the data currently expressed in it on a topic of your interest. Statements re-using properties are one important element of the structure with which wikidata lets us express and describe items in the world as we see them and let many version (worlds) of that exist in parallel, but in the very same database.
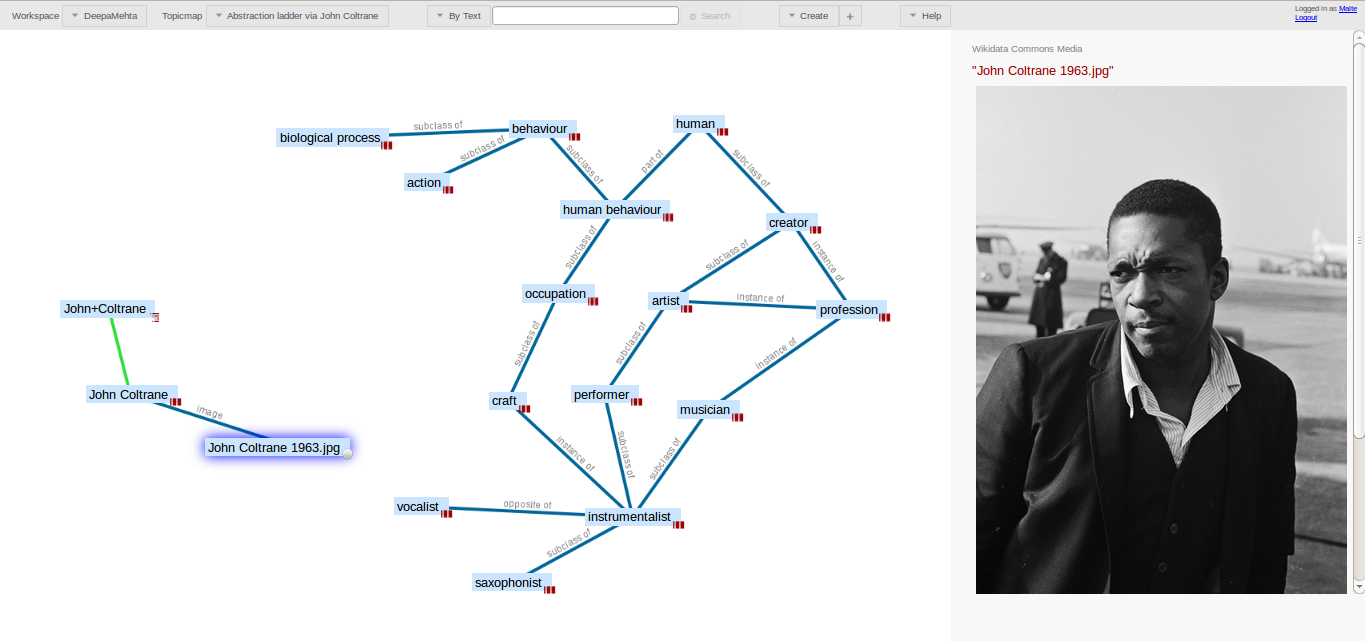
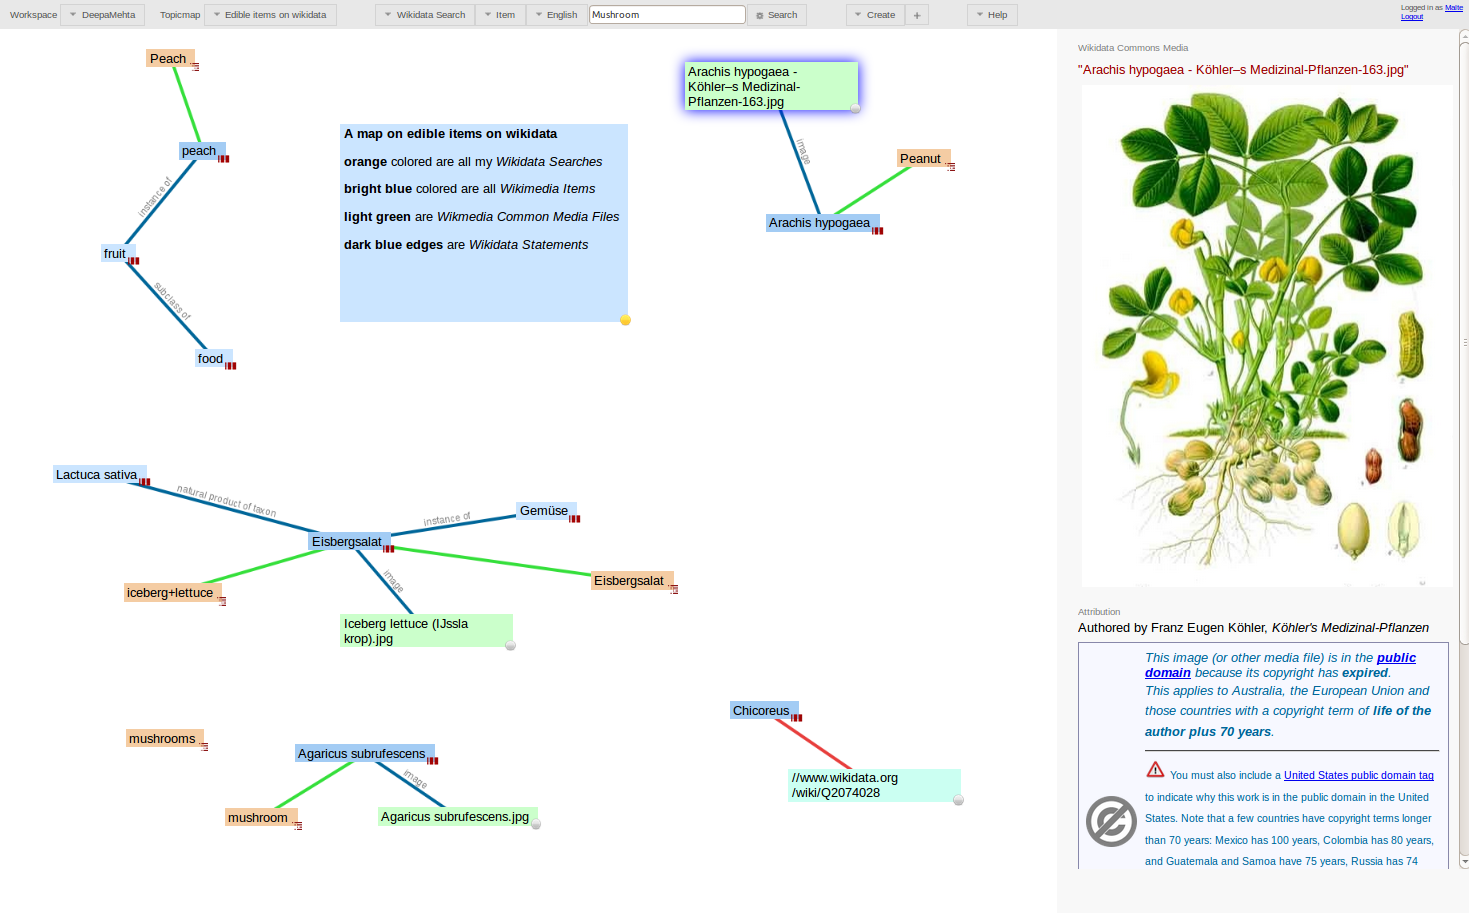
Another data source i integrated into this plugin just a couple of weeks ago is the custom Wikimedia Commons API endpoint. This integration now makes open media files (linked to items on wikidata) accessible and appear direct in your visualizations detail panel (right side of the screen). But let me highlight this again: All the data of wikidata is available behind the blank canvas. We used a plugin development environment which enables me and others (independently of me) to successively and interactively (basically while using it) extend the expressiveness of all visualizations making use of wikidata. It is just me who deployed a networked (graph) version of it, this Topicmaps UI. Let me give you a short overview about the basic commands you need to construct a view on wikidata.
To construct your personal visualization with Wikidata Topicmaps UI you need to find the following commands and start to use them:
- In the upper toolbar: Topicmap > New Topicmap > *Your Visualizations Name* > Create
- In the upper toolbar: Wikidata Search > Items > *Your Language* > *Your Query*
- On any Wikidata Search Result: Import claims – The item you select and reveal from the list presented after the wikidata search provides this command
- Drag and Drop wikidata items and associations with your mouse on the map panel so they do not overlap
- Hide in any items context menu to get rid of those items currently on the map which helped you to construct your view but which are no longer important for the contents you want to present
This is the way i created this map revealing a selection of states along Statements made in wikidata (the blue edges in the diagram) representing two properties, 1. has diplomatic relation and 2. shares border with.
If you share the URL from the address bar to your map, like i do, users who browse this webpage but do not have a wikidata topicmaps account can still interact with your visualization but can not modify (no write-permission) your arrangement persistently. Visitors can just take your arrangement a starting point to read through details of items, reveal other (currently hidden) related items or just temporarily re-arrange your construct to read through it.
Hint: If you have an item or property at hand in a Topicmap, you can reveal its URL and immediately start to browse and therewith edit the data on wikidata.org and i want to encourage you to do so, if you find out there is something valuable missing.
You can install this tool on your desktop machine or your own server if you have Java 6 or 7 installed and download DeepaMehta 4.4.x (not a 4.5 version) with the compatible dm44-wikidata-search plugin at http://download.deepamehta.de. If you want to join me hacking on this, here you find the backend related java code (to query wikidata) as well as the javascript (wikidata topicmaps specific) source code and here your find out how to get started with the plugin development for to easily develop a customization, adaptation, variation or extension. There are a couple of improvements we could work on, for example some might find it interesting to adapt the (existing) SVG Export functionality for Topicmaps to this wikidata use case so we can continue to work with wikidata in Inkscape. I tried to make it short but the basic infos grew and grew.
If you find this interesting, please get yourself a login here, start mapping, exploring and editing wikidata and spread the word.
Thanks for your time & support. Cheers!
Updated, 31 May 2015: Linking two more interactive examples here:
Footnotes, just to be precise:
1 Since so called Qualifiers on Statements are not yet respected in my visualizations it should read as “having or had a diplomatic relationship” and “shares or shared a border with” – this is something i would like to work on but also the amount of qualifiers (currently in the database) made it appear a “neglectable” detail for now, but certainly not for the future to come with wikidata.
Updated 31 May, 19.28: Added two more examples and the link to the video.
Nice! Please do add a video to qualify for the prizes.
Thanks!
Ok, thanks very much for your quick reply.
It was a bit hard to meet the 60s requirement but here we go http://youtu.be/7pn1dHWNb3E :)